Continued from The 192kHz Lie (Part 1)
Solution 1: Higher Sample Rate
We are first going to try doubling our sample rate. This means we will double the number of vertical lines and keep the horizontal lines the same. Take a look at how the ADC might convert our wave to digital data (Figure 7).
 Figure 7 |
Compared with Figure 5 we can already tell this looks a lot nicer. Take a look at our data after it comes back out of the DAC though (Figure 8).
 Figure 8 |
This is definitely better than Figure 6 but there is still quite a bit of stair stepping on the slopes and the peaks are not represented very accurately. Time to explore our next solution.
Solution 2: Greater Bit Depth
We are now going to return to our original sample rate and instead, double the bit depth. This means we will keep the original number of vertical lines and double the number of horizontal lines. Put the ADC to work building our data (Figure 9).
 Figure 9 |
Looks a little too sparse like Figure 5 but why don’t we take a look at what happens after Mr. DAC gets his hands on the data so we can get our ears on it (Figure 10).
 Figure 10 |
Well howdy doody! That is a near exact match. You can see some very slight differences but overall I think you will agree it is the closest we have gotten yet. Before passing a final judgment we should explore our third idea.
Solution 3: Higher Sample Rate and Greater Bit Depth
This time we are going to go all out and hold nothing back. We are doubling both and are not ashamed to admit it. Take the original grid, double the vertical lines (like in solution 1) and double the horizontal lines (like solution 2). This gives our ADC four times the amount of work but he is a computer and we don’t even care (Figure 11).
 Figure 11 |
There are dots everywhere. With this many dots it has got to be the closest ever. The DAC will also work four times as hard to give us the audible result (Figure 12).
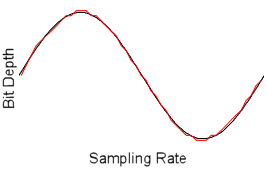 Figure 12 |
We are very close to our original wave here. The slopes look great but there are some conversion artifacts around the peaks. Decide whether you like Figure 10 or Figure 12 better for yourself, but my money is on Figure 10. This is a very subjective call. They are close enough that we can imagine both would sound much better than the original conversion and solution 1. We need more to go on before deciding which is a better gain.
Continued in The 192kHz Lie (Part 3)